Basemaps and Overlays
Satellite basemaps, overlays, a basemap per view, and Remove paper for scanned maps
Basemap sources
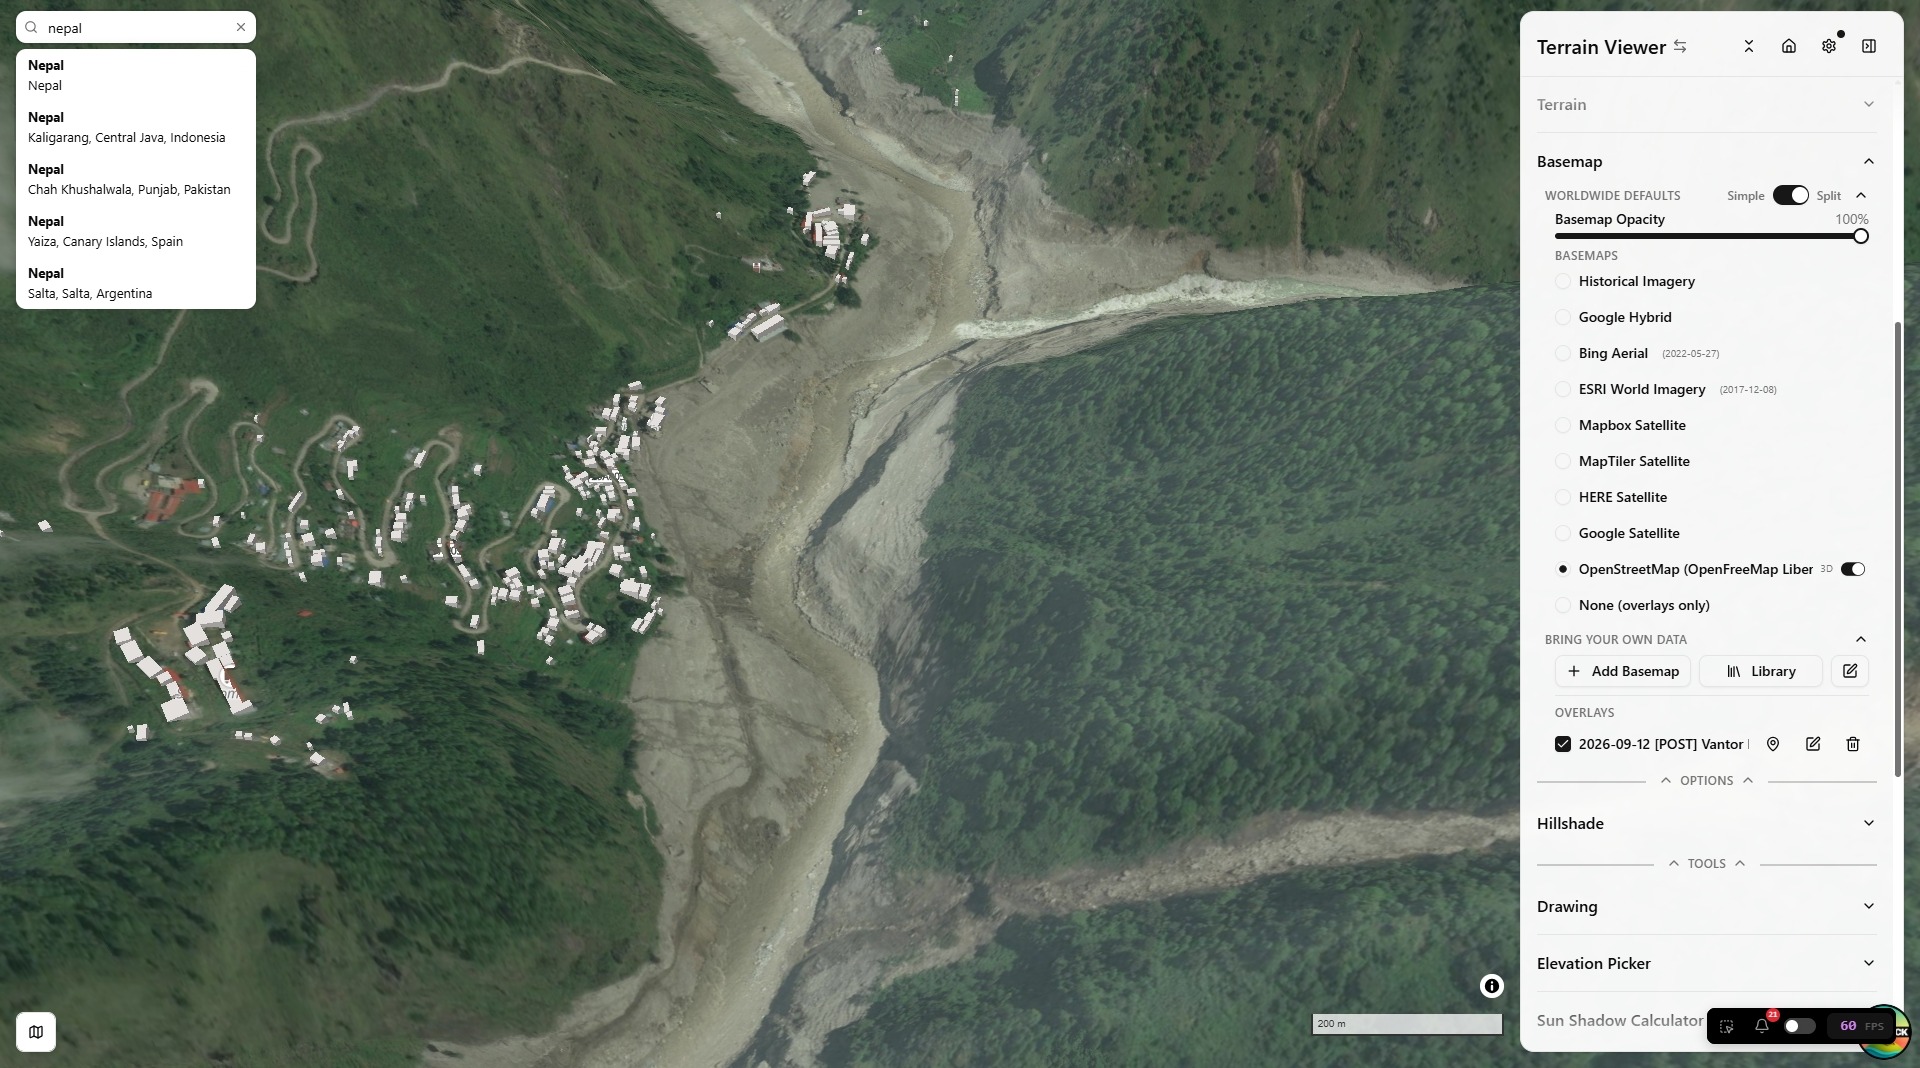
The Basemap section under Sources offers several satellite/hybrid basemaps (Google Hybrid, Bing Aerial, ESRI World Imagery, Mapbox Satellite, HERE Satellite, Google Satellite, OpenStreetMap) plus any custom source you've added — see Bring Your Own Data.
OpenStreetMap is OpenFreeMap's Liberty vector style rather than raster tiles, so it stays crisp at any zoom and can extrude OSM buildings with their recorded heights — the 3D switch on its row toggles them.
Overlays
Overlays have an opacity pill each, and the Overlays heading one for all of them (overlaysOpacity): click a pill and a short vertical slider opens on it, its point for the current value under the pointer, so a drag up or down sets it (bottom 0, top 100).
An overlay draws over the basemap instead of replacing it. Where the overlays sit in the layer stack is one setting for all of them, Stack in the Overlays group (overlaysStack in the link): Under relief (the default: hillshade and the colour relief draw over them), Over hypso (above the colour relief, still shaded by the hillshade) or On top (above every terrain layer, only contours and markers over them). Their order among themselves is the list's order (drag the handles in edit mode). The Basemap and Overlays groups fold. In a split or grid with per-view basemaps, each overlay row gets the view grid, so an overlay can be on view B only; clicking the overlay's name adds it to every view, or removes it from all of them when every view already shows it.
A basemap per view
In split view (grid layouts up to 4×2 / 8 views, labeled A–H), each basemap row shows an A–H button grid so a different source can be assigned per view. Clicking a row's label (not just its A–H buttons) sets every active view in the current grid layout to that source in one click — handy for putting a whole 4×2 comparison grid onto Historical Imagery without clicking each pane individually.
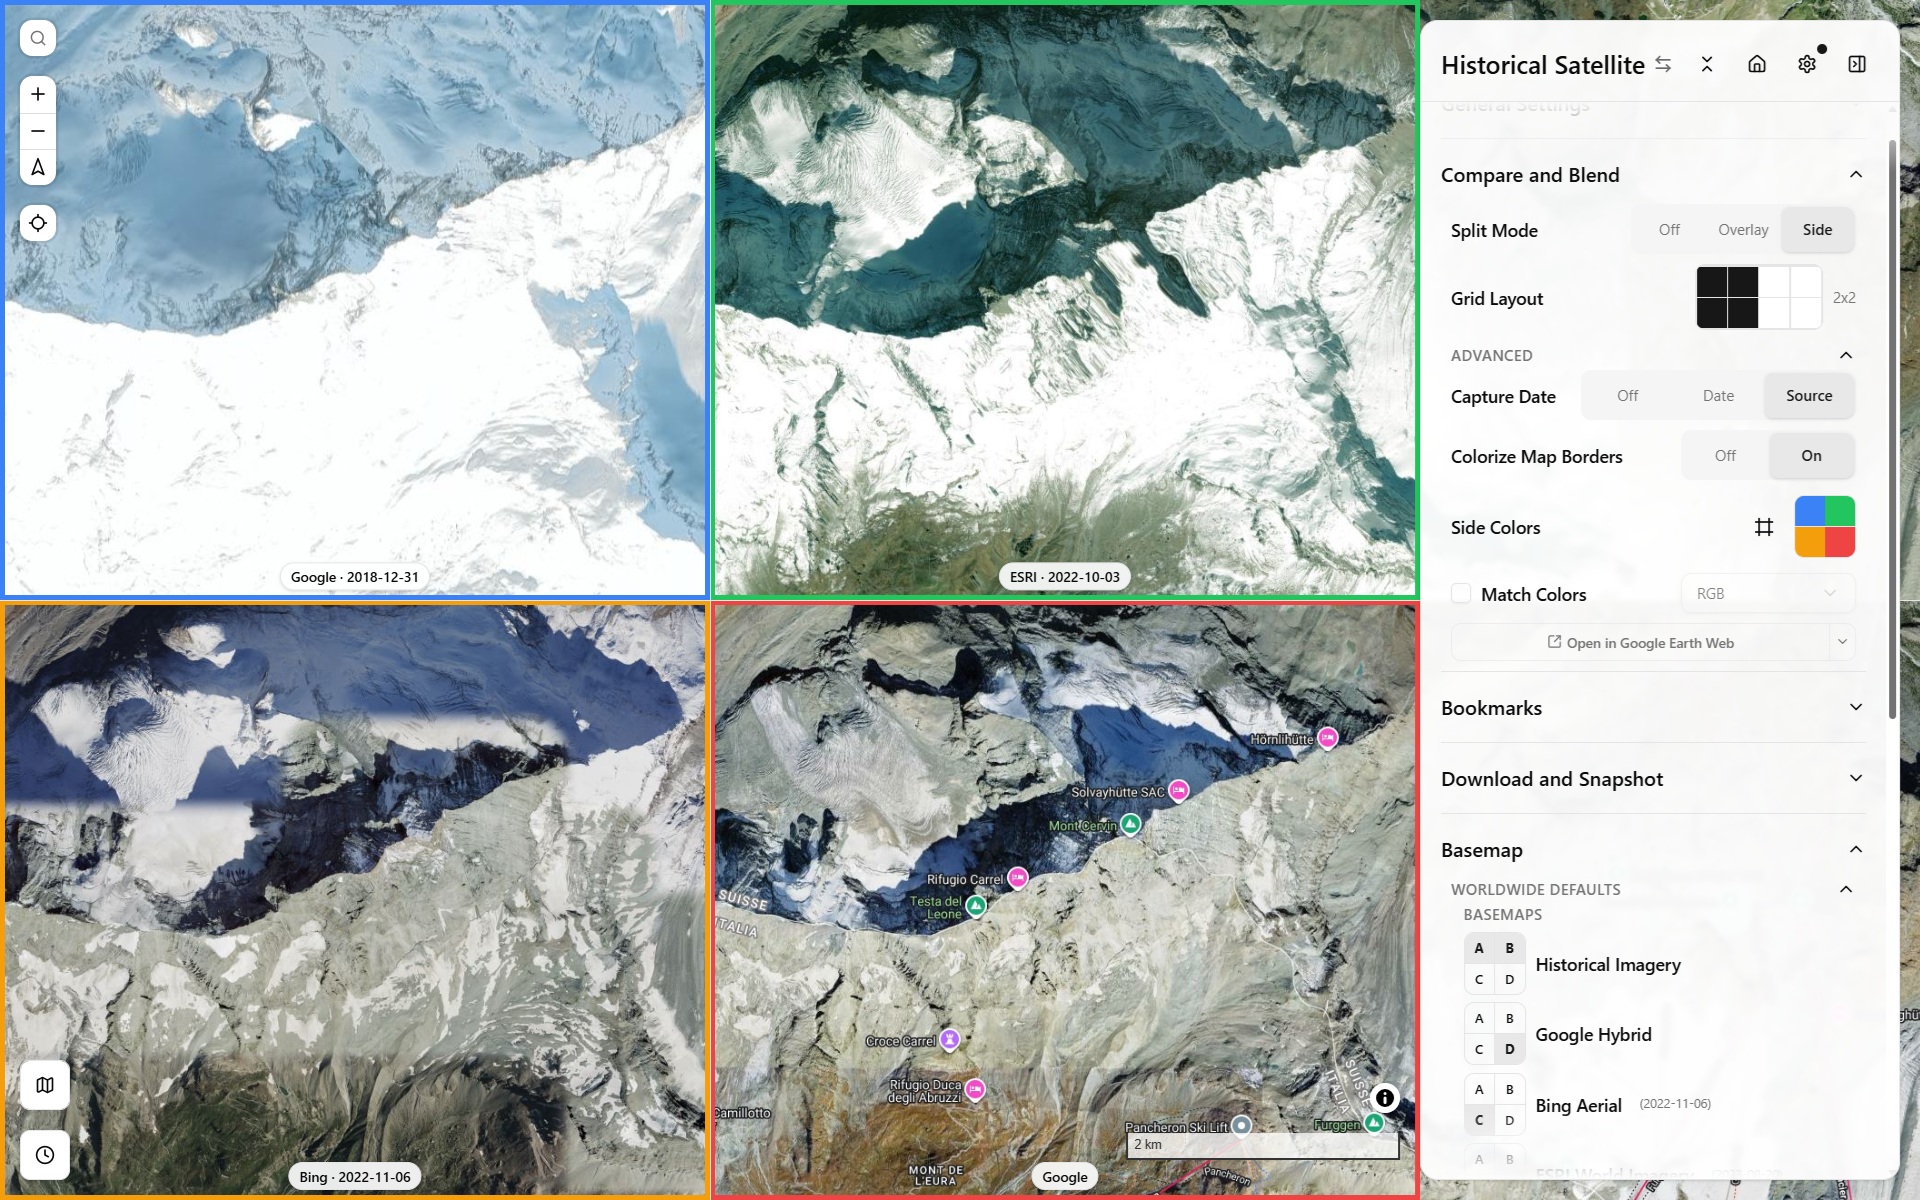
Basemap comparison, Side grid mode
A georeferenced IIIF map (an Allmaps overlay) is drawn one of two ways, chosen in its dialog under Draw it: warped in the browser, the sharpest, from the IIIF image itself, or from Allmaps' tile server (allmaps.xyz), warped and cached server-side, a plain raster that tilts and drapes on terrain and is much faster when the image server is slow (David Rumsey's). The in-browser warp draws in flat views only (Allmaps' layer has no pitch support yet, see Upstream requests), so a tilted view switches it to the tile server by itself and back at pitch 0; a toast says so the first time. Auto picks the tile server for a David Rumsey link.
Why the in-browser warp is sharper: it samples the original IIIF image at the exact scale of the screen and warps each pixel on the GPU, one resampling. The tile server renders 256 px PNG tiles at fixed integer zooms, and the map resamples those again when it draws them: two resamplings plus PNG quantisation. The tile server is slow on a first visit to an area because it has to fetch the source tiles from the image server and warp them; after that the tiles are cached and come back in a fraction of a second.
Remove paper
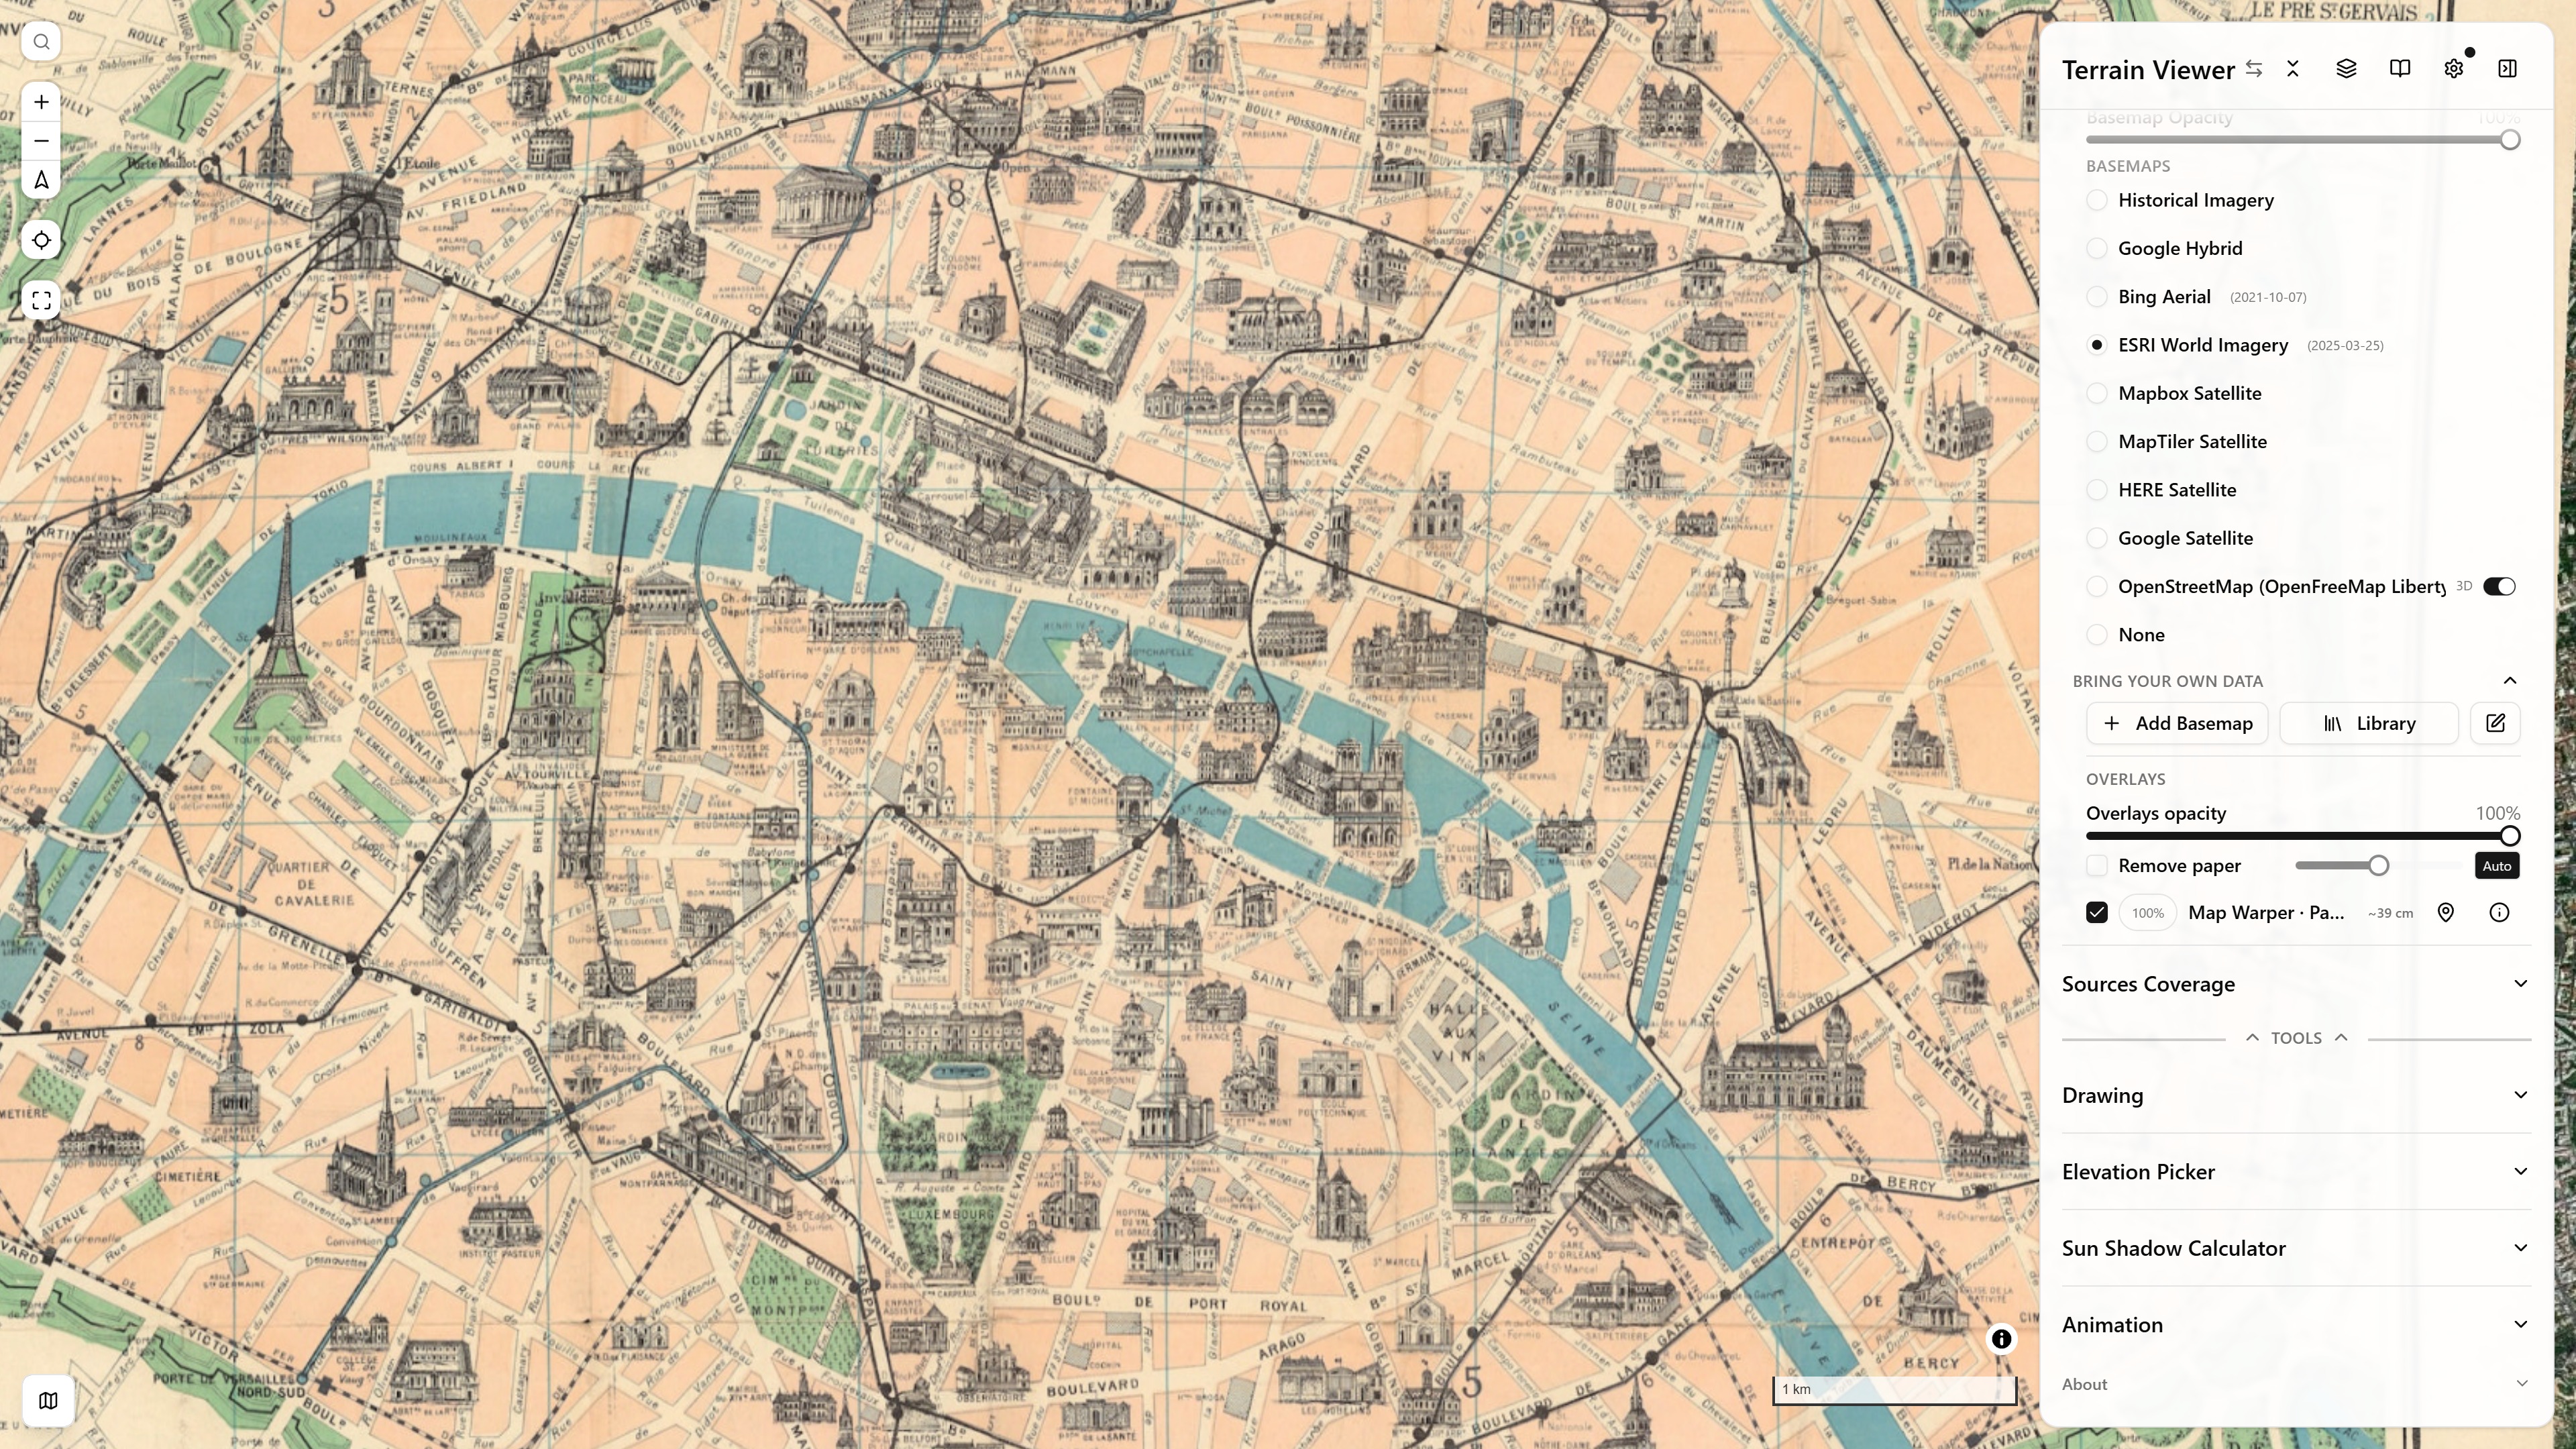
Remove paper off: Map Warper's Paris 1905 on the view as an overlay, its cream paper covering the imagery
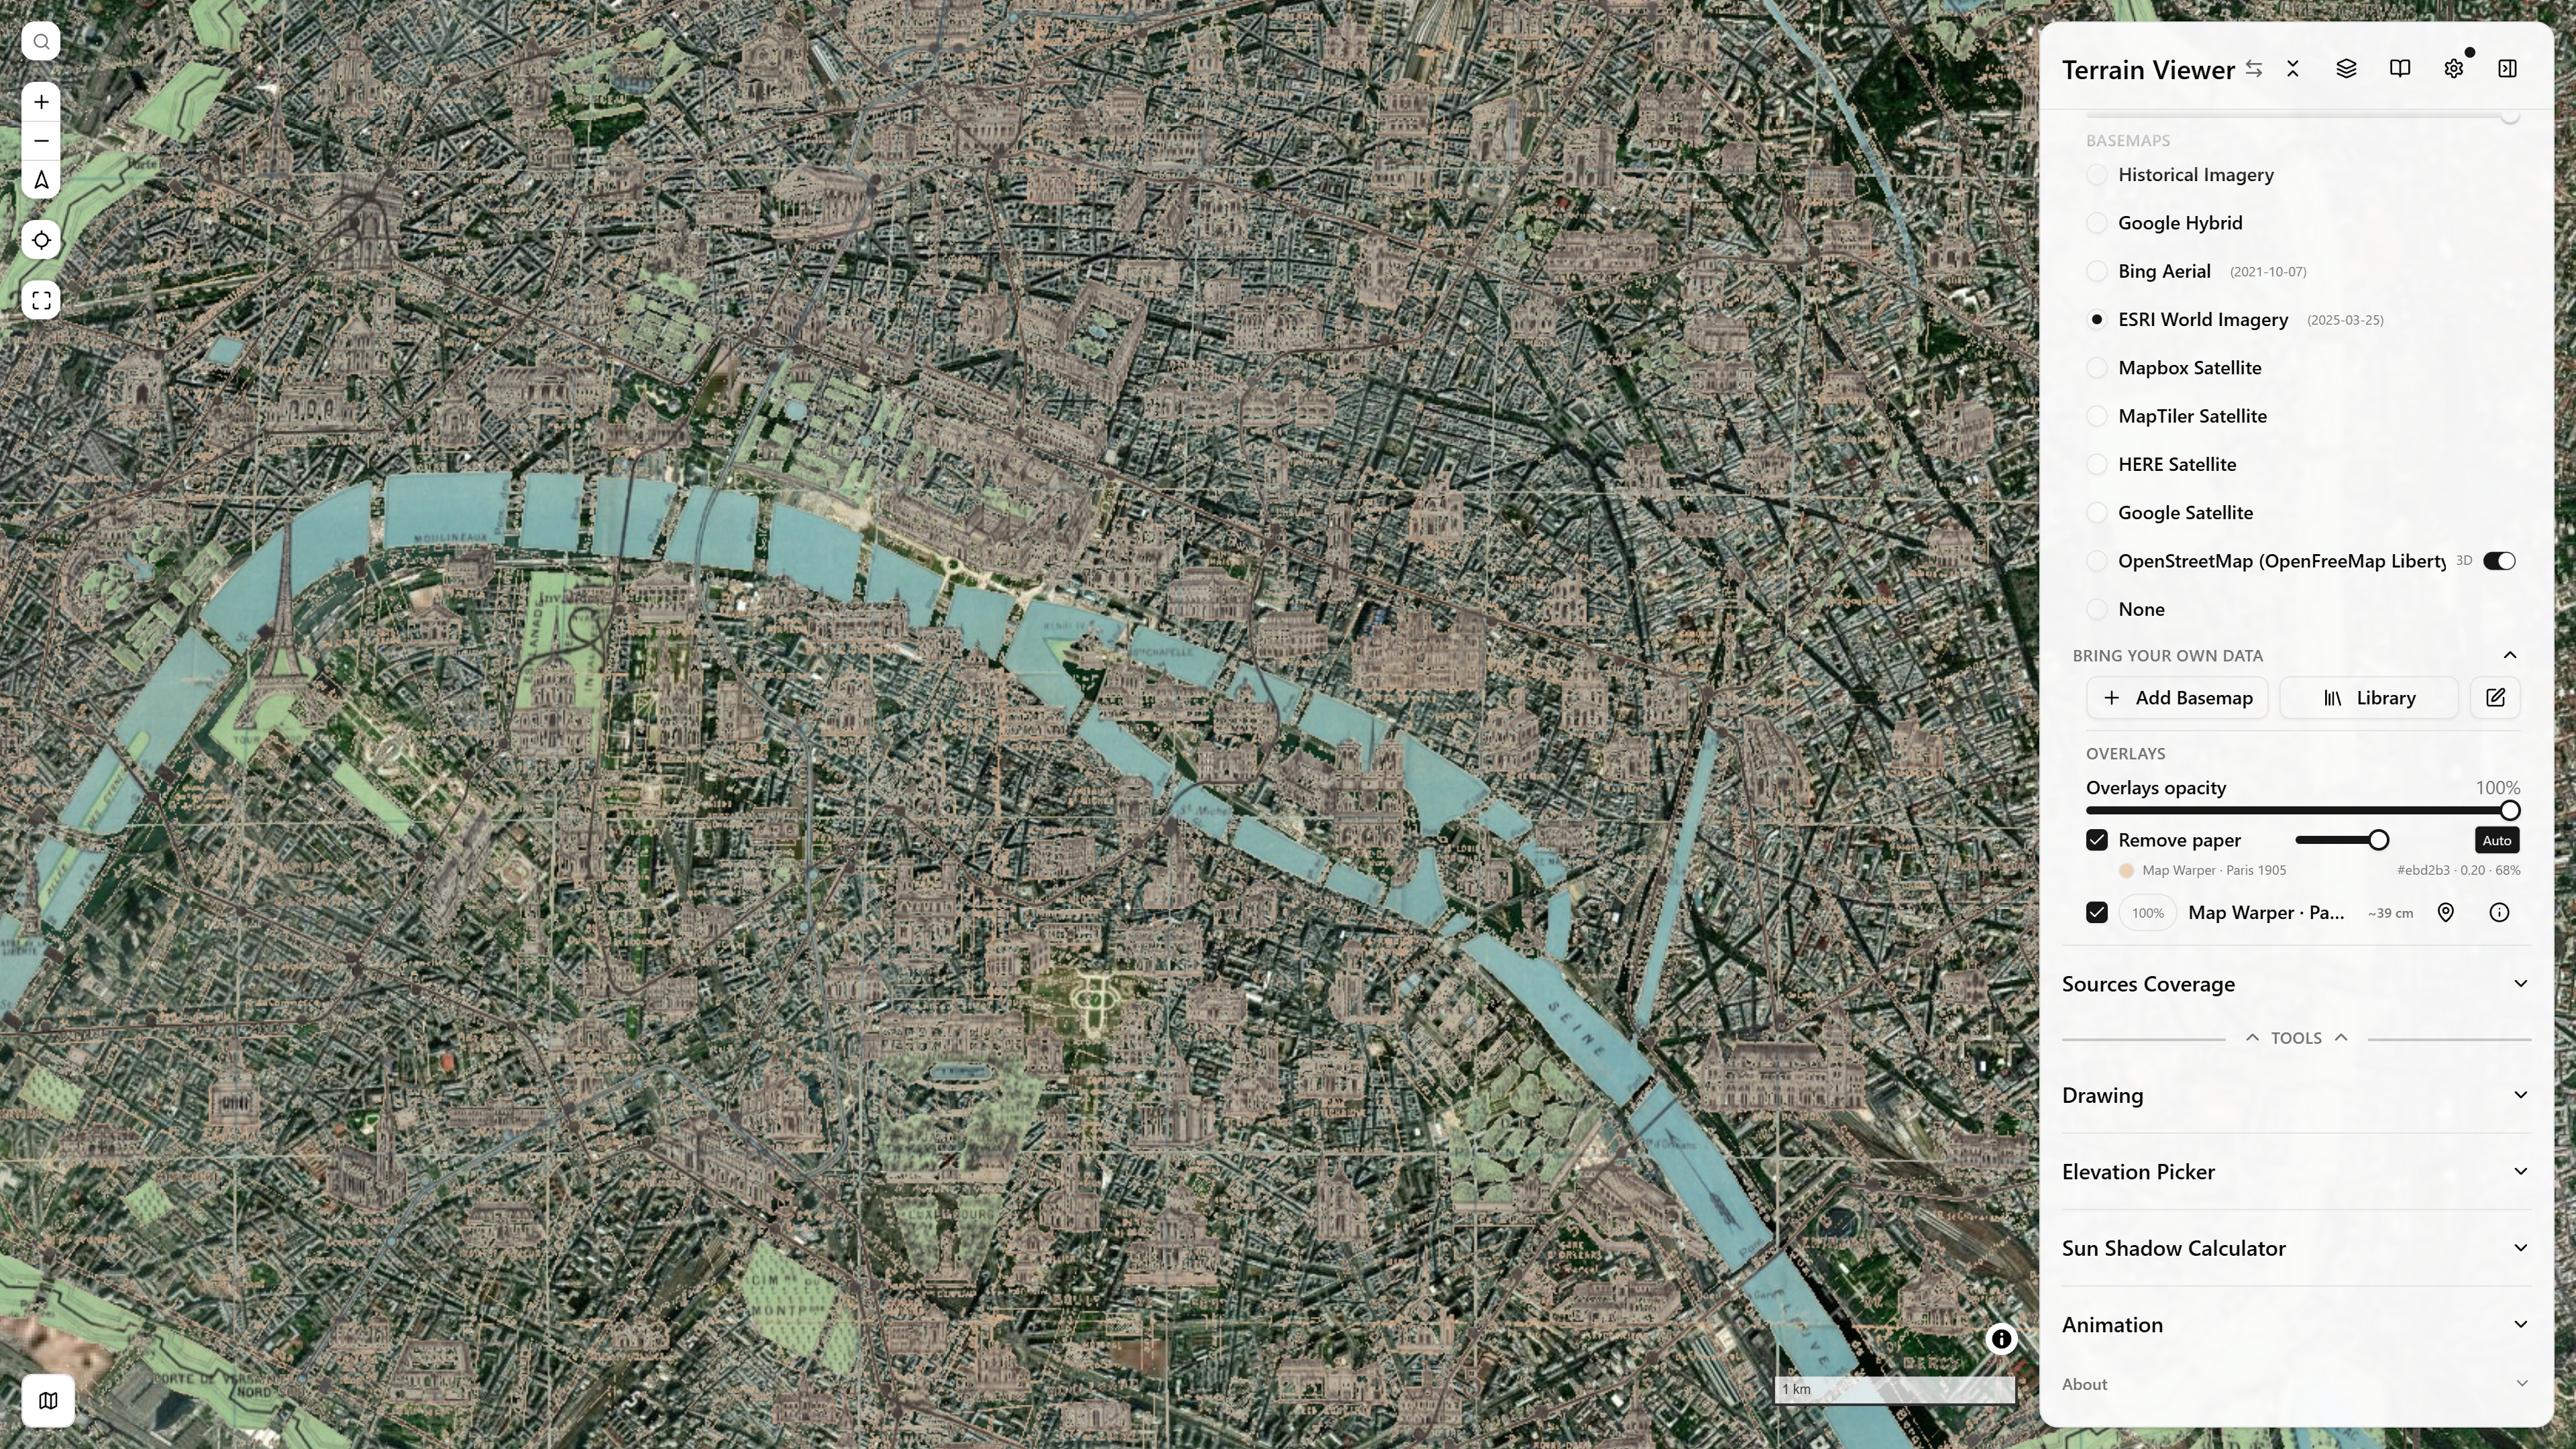
Remove paper on (Auto): the paper detected as #ebd2b3, threshold 0.20, 68% of the sheet; the buildings, the river and the parks stay
Remove paper turns the paper of scanned maps transparent, so an old map reads over today's imagery. It is in the Basemap section, under the Overlays heading (Bring Your Own Data), and only shows while a scanned map is on a view: a warped Allmaps map, or a tiled old map from Map Warper, Wikimaps Warper, SLUB, the USGS quads, or the swisstopo, Kartverket, NGI and Academia Sinica map series (as an overlay, or as a view's basemap picked on the timeline). It works like the Allmaps viewer's magic wand: the pixels close to the paper colour fade out.
- Auto (the default): each map gets its own paper colour and threshold from its own image. For an Allmaps map that is a 256 px rendition inside its georeference mask; for a tiled map, one tile at the centre of its extent. The luminance histogram is split in two by Otsu's method, the paper colour is the median of the bright part, and the threshold is where the pixels' distance to that colour falls away (at most 0.2, so an aged sheet keeps its colour washes).
- The line under the switch shows, per map, the paper colour, the threshold in use and the paper's share of the sheet, or "no paper, kept".
- A map is left as it is when its drawing fills the sheet (an engraving, a grey bird's-eye view): the paper must be light and cover 40% of the sheet, or three quarters when it is darker.
- The slider widens or narrows every detected threshold; the middle is as detected.
- Auto off: one colour (the swatch) and one threshold (the slider) for every map.
Limits: the removal is by colour, so map details close to the paper colour (a light road fill, pale washes) fade with it, and white margins outside the drawn frame go only if they are close to the paper colour. The setting is kept in your browser, not in the link.
Global DEM Tile Sources and Basemaps: Mapterhorn, Mapbox, MapTiler, AWS, Esri
The worldwide elevation tile sources behind the viewer (Mapterhorn, Mapbox Terrain-RGB, MapTiler, AWS Terrarium, Esri World Elevation LERC), their resolution and licences, and the satellite and map basemaps.
National LiDAR and DEM Data by Country, Free Elevation Services
Free elevation data from national mapping agencies, country by country, LiDAR DTM and DSM at 0.5 m to 30 m (France, the Netherlands, Spain, the UK, the USA, Canada, Japan and fifty more), viewed in the browser as terrain, no download.